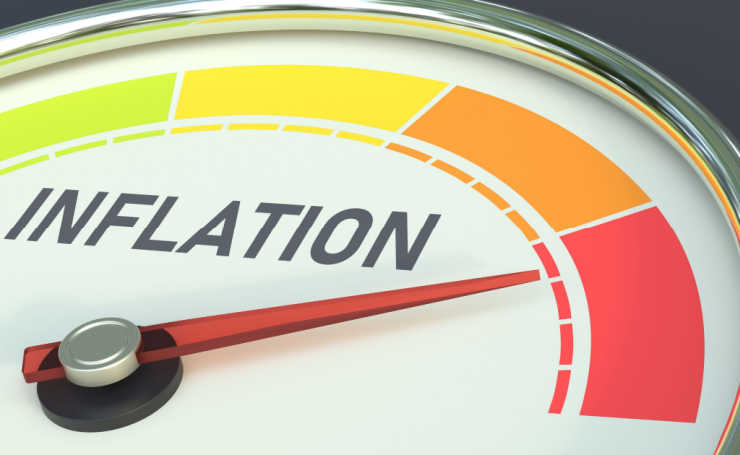
New inflation reports are pushing treasury yields even higher, as the market foresees more interest rate increases from the Fed, and demands more protection from inflation. Your best investor tool is the U.S. Treasury Yield Curve. Examine it closely on my chart below. Sam Goldfarb reports on the rising rates in The Wall Street Journal:
Another dismal inflation report delivered a heavy blow to the bond market Thursday, setting off a wave of selling that pushed the 10-year Treasury yield above 4%, toward 15-year highs.
Yields, which rise when bond prices fall, drifted lower overnight. But they surged immediately after inflation data came in worse than many had expected.
In recent trading, the yield on the benchmark 10-year U.S. was 4.061%, according to Tradeweb, up from 3.901% Thursday and 3.854% just before the data was released.
Coming into Thursday, investors had hoped to see a cooling in so-called core inflation, which excludes volatile food and energy categories. Those prices, though, rose 0.6% in September from the previous month–comfortably above the forecast of economists surveyed by The Wall Street Journal, who had expected a gain of 0.4%.
The 10-year yield, a key measure of borrowing costs, has briefly inched above 4% in a couple of overnight trading sessions in recent weeks. But it has yet to settle above that threshold.
Investors and economists pay close attention to longer-term Treasury yields because they set a floor on interest rates across the economy and establish a benchmark forward-looking return against which other assets, like stocks, are measured.

If you’re willing to fight for Main Street America, click here to sign up for my free weekly email.


