You can try this one at home. Ask any investor you know how to calculate a company’s market cap and chances are you’ll be met with a blank stare.
A company’s market cap is its shares outstanding multiplied by its stock price. It amazes me how such an influential calculation is overlooked and not understood. The popular S&P 500 and Nasdaq indices are both market cap weighted yet investors don’t know what that means.
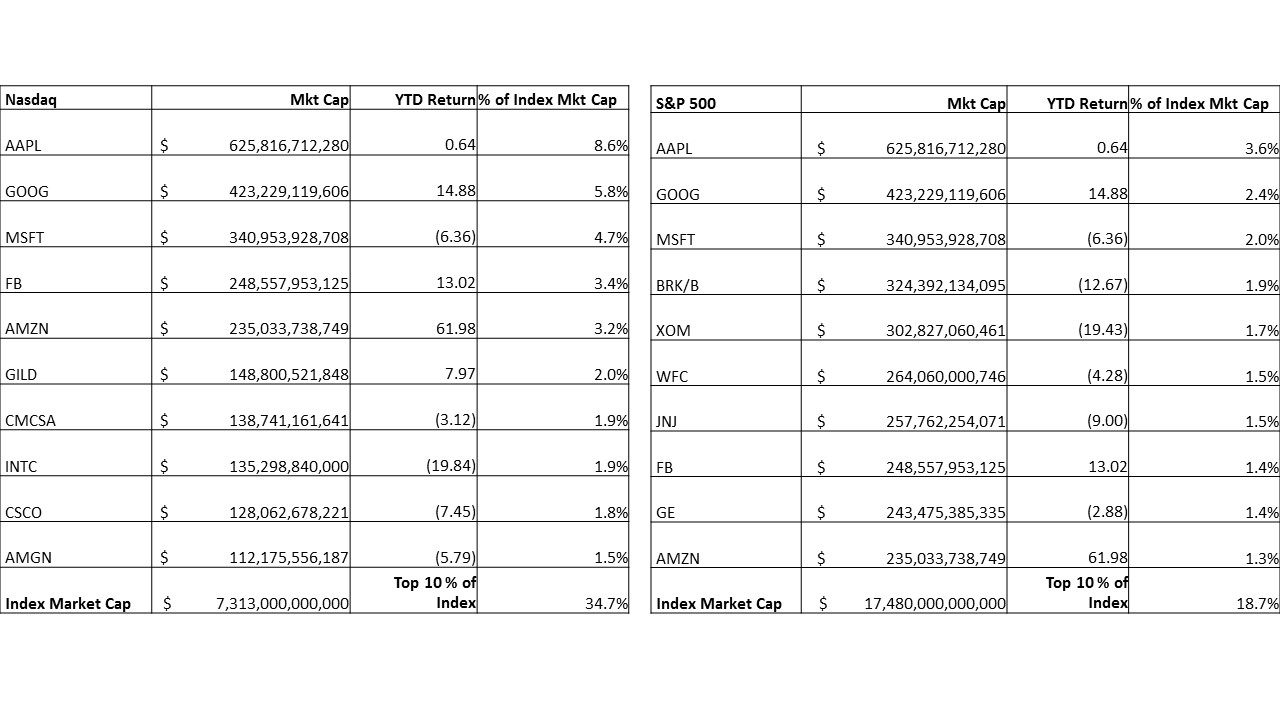
The larger the market cap, the larger the influence a particular stock will have on the direction of the index. The top-10 stocks in the S&P 500 and the Nasdaq have a huge impact on overall returns.
Take a look at the two tables below for the top-10 stocks by market cap for the Nasdaq and S&P 500. The top-10 stocks comprise 34.7% and 18.7% of the total market cap for their respective indices. That’s a huge influence by one group over an index that’s supposedly diversified.
It’s incredible how many investors let market cap run the show.
A different approach is to focus on dividends. An even better approach is to look for companies with at least 10-years of dividend increases. We do this with our Retirement Compounders common stock program. There’s a certain peace of mind gained from getting cold hard cash from a company even in rough years like this one and 2008, for example.
When I scan the list of names in the top-10 of the S&P 500 and the Nasdaq many of them haven’t even been a public company for ten years, never mind paying a dividend or increasing their dividend.
Don’t let market cap ruin your portfolio. Focus on what’s important to you. Getting paid a dividend to be invested in this market is a simple calculation everyone can understand.
Click to enlarge.